CHatter:
Community Health Air Tracker
CHATTER is a tool that shows how air pollution levels change over time and what those changes could mean for people’s health in the communities and surrounding areas. While air pollution affects everyone, communities nearer industrial sources experience higher levels of hazardous air pollutants and the associated human health risk than those that are not.
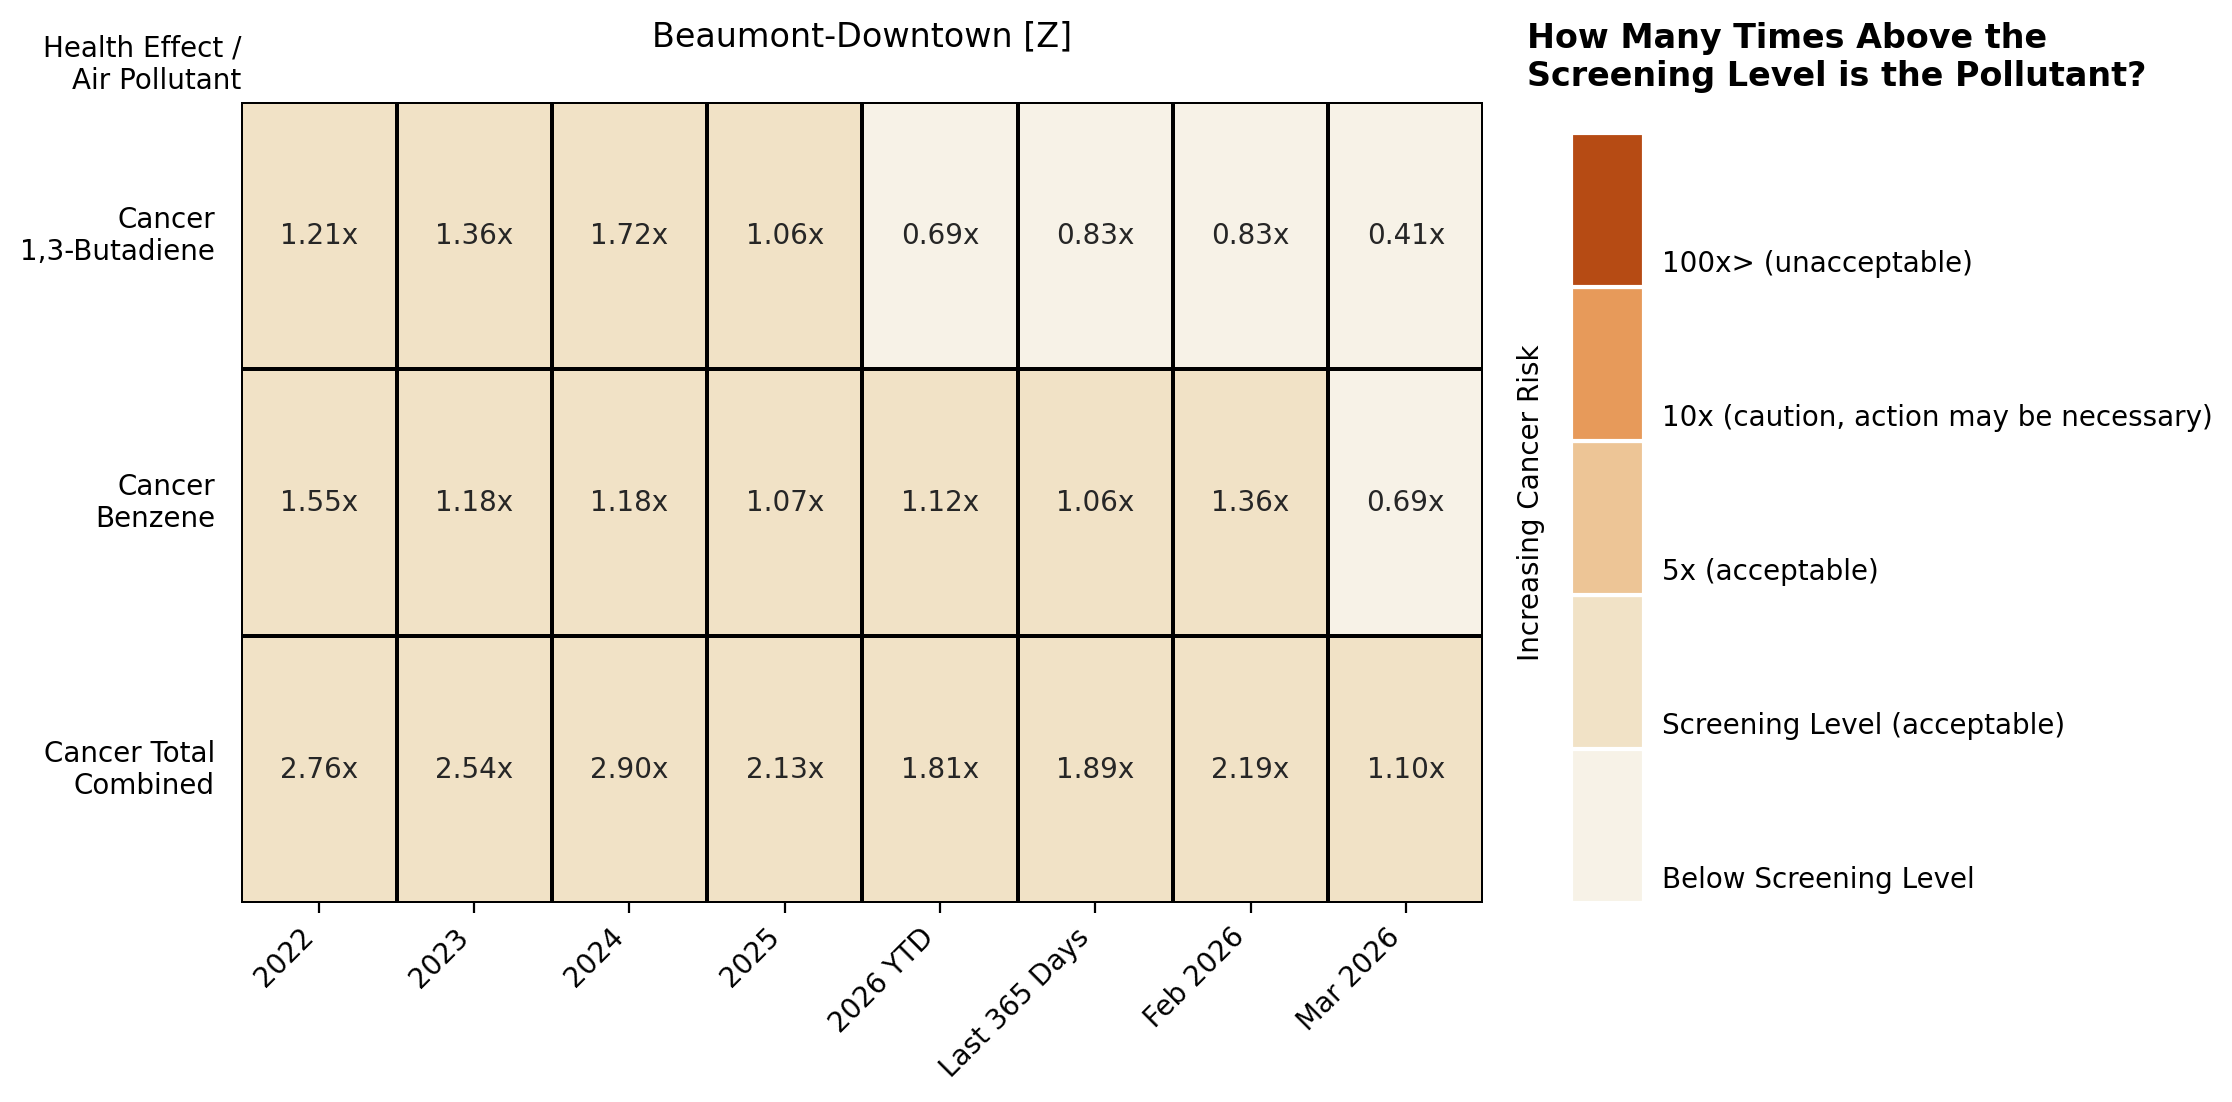
CHATTER helps determine whether air pollution levels measured at local monitors may be high enough to affect human health and whether additional action may be needed to reduce exposures. Screening levels are air pollution concentrations or thresholds that scientists use to identify when long-term exposure may increase the risk of health problems. Exceeding a screening level does not mean health effects will occur, it indicates a need to take additional steps like verifying measurements or taking pollution reduction actions to protect health.
The health risks CHATTER show apply to a resident living in the area breathing air pollution for a long time.
Select your community
Click to button to view
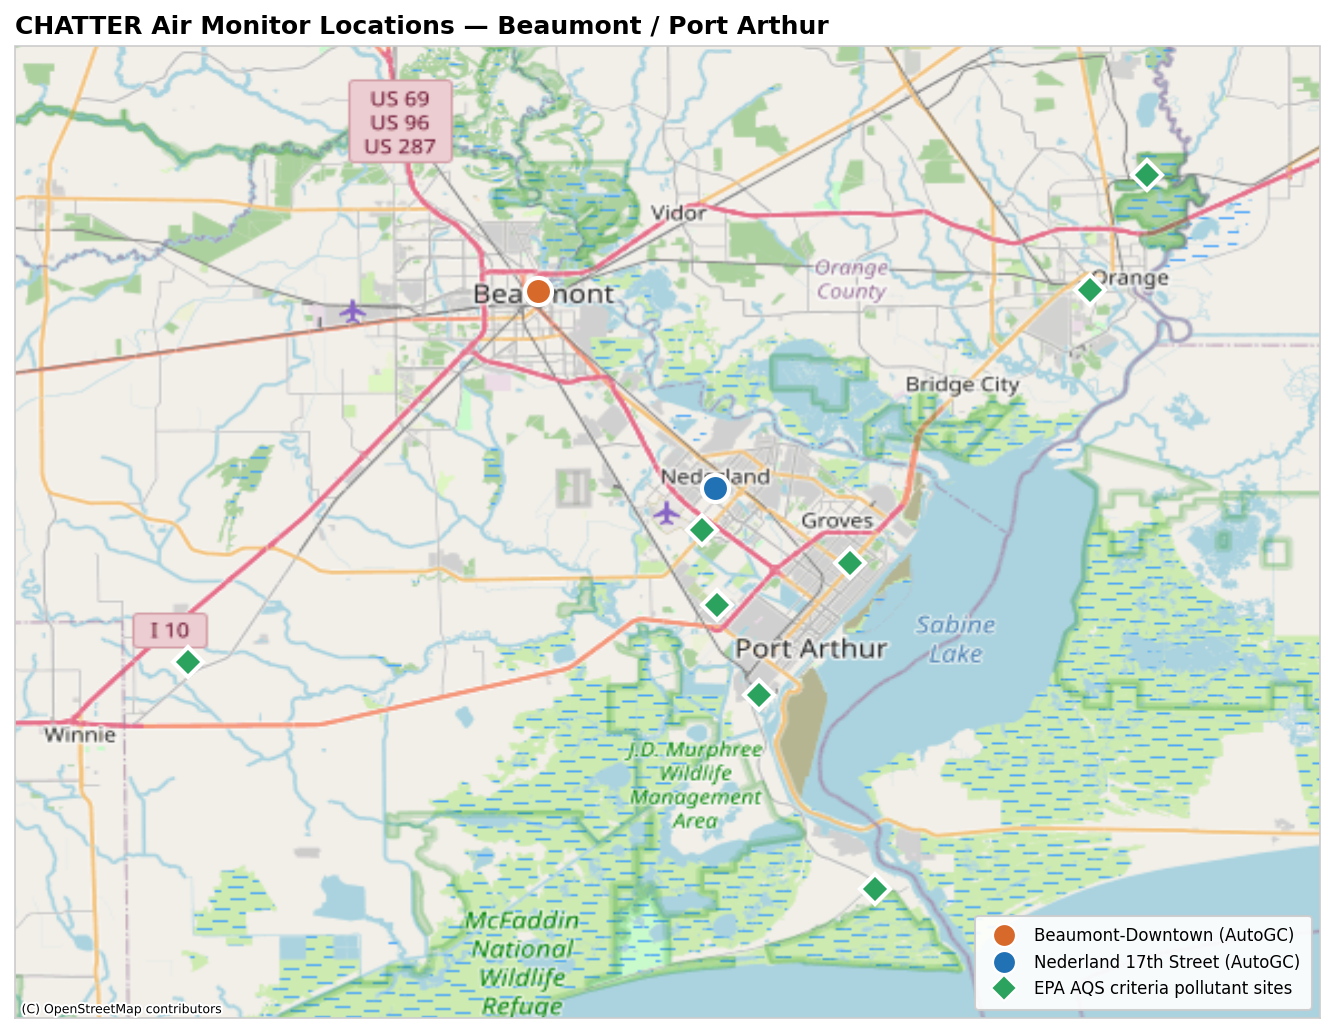
Example Outputs Below